← All Posts
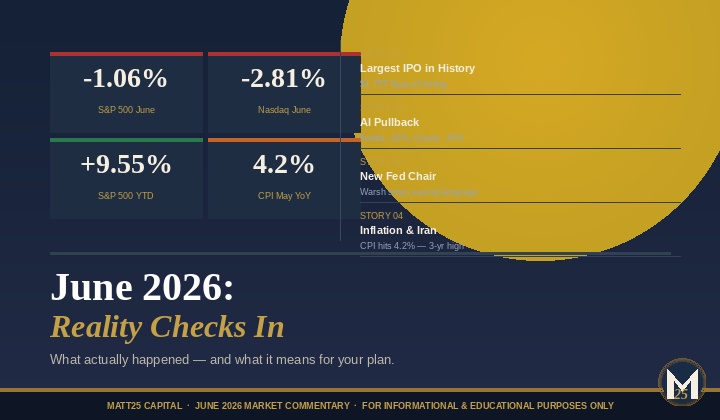
June 2026:
Reality Checks In
After back-to-back gains of 9.67% and 5.3%, June brought a modest pullback — and four stories worth understanding before you decide what, if anything, to do.
After back-to-back gains of 9.67% and 5.3%, June brought a modest pullback — and four stories worth understanding before you decide what, if anything, to do.
Sources: CNN Business, Vested Finance, CNBC, Bureau of Labor Statistics. Past performance is not indicative of future results.
After April's 9.67% surge and May's 5.3% follow-through, the S&P 500 slipped about 1% in June and the tech-heavy Nasdaq fell 2.81%. In context, this is barely a footnote: the S&P 500 finished the first half of 2026 up 9.55% — almost exactly its long-term average annual return, captured in six months. The S&P 500 and Nasdaq had their best quarter in six years in Q2, bouncing back from the Iran war-related March slide.
The June pullback wasn't surprising. After a nearly vertical recovery from the March lows, some digestion was healthy. What matters more is understanding the specific forces that drove it.
| Index | June 2026 | YTD 2026 | Q2 (Apr–Jun) |
|---|---|---|---|
| S&P 500 | −1.06% | +9.55% | ~+13% |
| Nasdaq | −2.81% | +12.79% | ~+17% |
| Dow Jones | +2.5% | +8.8% | ~+12% |
| Russell 2000 (small cap) | Mixed | +21.9% | +20.9% |
Sources: CNN Business, Wespath/Vested Finance data as of June 26–30, 2026. Past performance is not indicative of future results.
On June 12th, SpaceX went public on the Nasdaq at $135 per share, raising $85.7 billion at a $1.75 trillion valuation — the largest IPO in capital markets history. Within days the stock surged, briefly pushing SpaceX above Amazon and Microsoft in market cap. By late June it was trading near $192 per share, roughly $2.5 trillion in total value.
For context: SpaceX cannot enter the S&P 500 until at least mid-2027 (it needs four quarters of GAAP profitability first). It did enter the Nasdaq-100, triggering an estimated $22–27 billion in forced institutional buying from index funds. The IPO captured the market's imagination about AI, space, and the next wave of American innovation — but it also raised pointed questions about valuations. At $2.5 trillion, the company is burning roughly $9 billion per quarter in capital spending, with no path to free cash flow profitability until 2031 by Goldman Sachs estimates.
If you own Nasdaq-100 index funds, you now own SpaceX — whether you chose to or not. The $22–27 billion in forced index buying may also create short-term volatility for other Nasdaq-100 names as funds rebalance. This is one of several reasons to understand what's actually inside your index funds, not just the label.
After an extraordinary run — the semiconductor index gained more than 230% in 14 months — AI and chip stocks hit a wall in the second half of June. Nvidia fell approximately 16% from its June 10 peak. Broadcom fell 14%. Microsoft dropped 17% for the month, its worst since 2000. Oracle fell 35%, its worst month since 1990.
The Dow, however, rose 2.5% as investors rotated into financials, healthcare, and industrials. This is a healthy pattern — a broadening of market leadership beyond a handful of technology names.
For long-term investors, the key distinction is between a sector rotation and a structural breakdown. The AI investment thesis — data center buildout, infrastructure spending, productivity gains — has not reversed. What has reversed is the assumption that momentum-driven valuations could expand indefinitely without earnings to support them. This is a healthy correction. It does not change the long-term case for owning quality businesses in growing sectors.
On June 17th, Kevin Warsh chaired his first Federal Reserve meeting. The Fed held rates steady at 3.50–3.75% — as expected. What wasn't expected was the tone.
Warsh stripped the Fed's usual easing language from the policy statement, declined to submit his own interest rate projections, and announced five task forces to overhaul Fed communications. The statement was shorter and blunter. His message was clear: the Fed is focused on bringing inflation back to 2%, and the era of easy forward guidance is over.
The market reacted. The 2-year Treasury yield jumped 16 basis points in a single day — the biggest single-day move since March 2008. Nine of 18 FOMC members now project a rate hike by year-end. Markets are pricing in roughly a 50% chance of a hike before December.
| Metric | Before June Meeting | After June Meeting |
|---|---|---|
| Fed Funds Rate | 3.50–3.75% | 3.50–3.75% (held) |
| Easing bias in statement | Yes | Removed |
| Members projecting hike in 2026 | 0 | 9 of 18 |
| Fed 2026 inflation forecast (PCE) | 2.7% | 3.6% |
| Market-implied odds of hike by Dec | ~24% | ~50–61% |
Source: Federal Reserve June 2026 FOMC meeting materials. Market-implied probabilities from CME FedWatch as of late June 2026. For informational purposes only.
What this means practically: the bond market is repricing for a world where rates stay higher for longer, or even move higher. For retirees and near-retirees, this affects everything from bond valuations to the cost of lifetime income products. It's a reason to revisit your fixed income allocation — not reactively, but thoughtfully, as part of a broader plan review.
May inflation came in at 4.2% year-over-year — the highest reading in more than three years, driven primarily by energy costs tied to the Iran conflict. The May PCE (the Fed's preferred inflation gauge) showed 4.1% headline and 3.4% core. The ceasefire held through most of June, but fractured repeatedly — with fresh U.S. airstrikes in early June after Iran was accused of shooting down a U.S. helicopter near the Strait. A 60-day ceasefire extension was announced near month-end, with the Strait remaining functionally open but below pre-war shipping levels.
Inflation at 4.2% is double the Fed's target and well above what most retirement income strategies were designed to assume. For anyone drawing on a fixed portfolio, this is a real headwind — one that compounds quietly over time. It's one of the primary reasons we emphasize inflation-awareness in every retirement income plan we build.
The following is provided for informational context only and does not represent a forecast or prediction of market performance.
The first half of 2026 was genuinely remarkable. The S&P 500 absorbed an oil shock, a Strait of Hormuz closure, a historic Fed leadership transition, the largest IPO in history, and persistent inflation above 4% — and still delivered roughly its long-term average annual return in six months.
The second half brings real uncertainty: potential rate hikes, a fragile ceasefire, and an earnings season that will test whether corporate America can keep performing through tighter conditions. None of this changes the fundamental discipline of long-term investing. But it does underscore why having a plan — and staying anchored to it — matters most precisely when the news is loudest.
As always, if you have questions about your specific situation, we're here for that conversation.
Markets will always deliver surprises. A well-built plan shouldn't. If you'd like to talk through how June's developments affect your retirement picture, reach out.
Schedule a Conversation